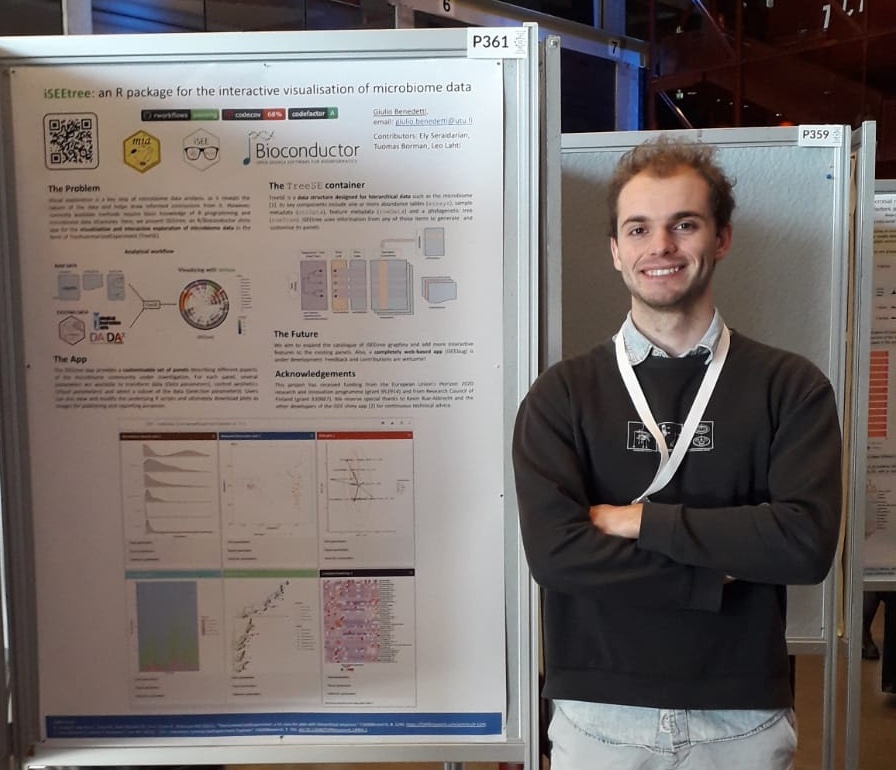
My poster at ECCB 2024 🦠
I am happy to share the poster I presented at this year’s European Conference of Computational Biology in Turku. Other participants gave me very useful feedback!

In the poster, I described the recently developed iSEEtree shiny app, for the interactive exploration of hierarchical data. It is freely available on Bioconductor at this address.
You can give it a try in R as follows:
library(iSEEtree)
library(mia)
library(scater)

# Import TreeSE
data("Tengeler2020", package = "mia")
tse <- Tengeler2020

# Add relabundance assay
tse <- transformAssay(tse, method = "relabundance")

# Add reduced dimensions
tse <- runMDS(tse, assay.type = "relabundance")

# Launch iSEE
if (interactive()) {
  iSEE(tse)
}